
Claude Haiku 5.5 (max) vs GPT-5.6 Terra (high)
Results updated 3 November 2026 · In Claude Code and Codex, so part of any gap can come from the harness · How we benchmark
Verdict


Claude Haiku 5.5 (max) beats GPT-5.6 Terra (high) by 9 points, and is cheaper; GPT-5.6 Terra (high) is faster.
- Cost per task
- $0.079 vs $0.10
- Time per task
- 7.8 min (estimated) vs 0.8 min
- Tokens per attempt
- 859k vs 162k
- Image input
- Yes vs Yes
Claude Haiku 5.5 (max), Claude Code scores higher than GPT-5.6 Terra (high), Codex on all 4 evaluations scored for both. Claude Haiku 5.5 (max), Claude Code is cheaper ($0.079 against $0.10 per task), but GPT-5.6 Terra (high), Codex is faster (0.8 min against 7.8 min).
All
Geospatial Agent Index: Text only
Equal average of Earth-Bench V2, GeoBenchX and GS-QA2, 0 to 100 · Higher is better
Data table: Geospatial Agent Index: Text only


Open weights
Geospatial Agent Index: Text only
Equal average of Earth-Bench V2, GeoBenchX and GS-QA2, 0 to 100 · Higher is better
Data table: Geospatial Agent Index: Text only
Where they differ most
By kind of work, share of tasks passed, 0 to 100 · Higher is better
| Kind of work | Claude Haiku 5.5 (max) | GPT-5.6 Terra (high) |
|---|---|---|
| Recognising infeasible requests | 86 | 60 |
| Climate and time series | 76 | 61 |
| GIS analysis | 91 | 77 |
| Making maps | 85 | 74 |
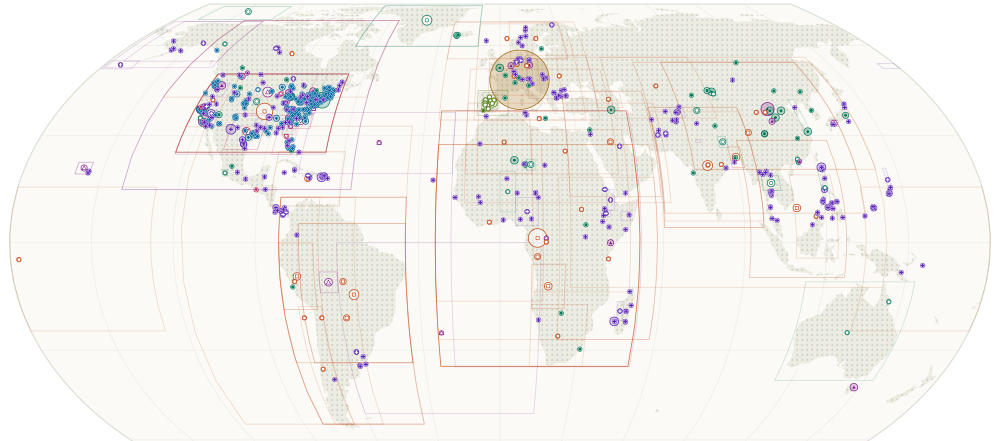 Where the tasks are set: each kind of work links to its tasks and scores
Intelligence
Text only
All
Geospatial Intelligence Index: Text only
Weighted average of agent tasks, guided workflows and geospatial knowledge, 0 to 100 · Higher is better
How to read this chart
What this metric means. A weighted average of group scores, each 0 to 100: Agent tasks 4/6, Guided workflows 1/6, Geospatial knowledge 1/6.
Data table: Geospatial Intelligence Index: Text only
Open weights
Geospatial Intelligence Index: Text only
Weighted average of agent tasks, guided workflows and geospatial knowledge, 0 to 100 · Higher is better
How to read this chart
What this metric means. A weighted average of group scores, each 0 to 100: Agent tasks 4/6, Guided workflows 1/6, Geospatial knowledge 1/6.
Data table: Geospatial Intelligence Index: Text only
| Model | Developer | Geospatial Intelligence Index: Text only |
|---|---|---|
| Kimi K3 (Reasoning) Open weights | Moonshot AI | 81.5 |
| DeepSeek V4 Pro (max) Open weights | DeepSeek | 79.0 |
| GLM-5.2 (max) Open weights | Z.ai | 78.4 |
| GPT-5.6 Terra (high) | OpenAI | 77.5 |
| DeepSeek V4 Flash (max) Open weights | DeepSeek | 77.2 |
| GLM-5.3 (max) Open weights | Z.ai | 77.1 |
| Qwen 3.8 27B (xhigh) Open weights | Alibaba (Qwen) | 75.1 |
| Nemotron 3 Ultra (high) Open weights | NVIDIA | 73.7 |
| GLM-5.3-Flash (max) Open weights | Z.ai | 71.0 |
| Gemma 4 26B A4B (Reasoning) Open weights | 64.4 | |
| Step 5 Preview (Reasoning) Open weights | StepFun | 63.8 |
| MiniMax M3.1 Flash (max) Open weights | MiniMax | 60.5 |
| Nemotron 3.5 Super VL 120B (Reasoning) Open weights | NVIDIA | 59.0 |
| gpt-oss-120b (high) Open weights | OpenAI | 51.9 |
| GLM-4.7-Flash (Reasoning) Open weights | Z.ai | 49.6 |
| Mistral Large 3 (Non-reasoning) Open weights | Mistral AI | 44.5 |
| Nemotron 3 Nano Omni 30B (Reasoning) Open weights | NVIDIA | 31.9 |
| Nemotron 3.5 Lightning 30B (Reasoning) Open weights | NVIDIA | 27.4 |
| gpt-oss-20b (high) Open weights | OpenAI | 22.1 |
| Llama 3.3 70B (Non-reasoning) Open weights | Meta | 19.9 |
Text + vision
Geospatial Intelligence Index: Text + vision
Weighted average of agent tasks, vision, guided workflows and geospatial knowledge, 0 to 100 · Higher is better
How to read this chart
What this metric means. A weighted average of group scores, each 0 to 100: Agent tasks 4/8, Vision 2/8, Guided workflows 1/8, Geospatial knowledge 1/8.
Data table: Geospatial Intelligence Index: Text + vision
| Model | Developer | Geospatial Intelligence Index: Text + vision |
|---|---|---|
| Claude Opus 5.5 (xhigh) | Anthropic | 82.7 |
| GPT-6.1 Sol (xhigh) | OpenAI | 79.8 |
| Claude Sonnet 5.5 (xhigh) | Anthropic | 78.9 |
| GPT-6 Sol (high) | OpenAI | 77.8 |
| Claude Opus 5 (high) | Anthropic | 77.4 |
| GPT-5.6 Sol (high) | OpenAI | 75.5 |
| Claude Haiku 5.5 (xhigh) | Anthropic | 75.1 |
| Claude Opus 4.8 (high) | Anthropic | 74.0 |
| Claude Sonnet 5 (high) | Anthropic | 73.2 |
| Claude Opus 4.7 (high) | Anthropic | 72.8 |
| GPT-5.6 Luna (xhigh) | OpenAI | 72.8 |
| GPT-6 Luna (xhigh) | OpenAI | 72.3 |
| GPT-5.6 Terra (high) | OpenAI | 71.5 |
| Claude Haiku 4.5 (Reasoning) | Anthropic | 53.1 |
By evaluation
All
Earth-Bench V2
higher is better
Data table: Earth-Bench V2
GeoBenchX
higher is better
Data table: GeoBenchX
GS-QA2
higher is better
Data table: GS-QA2
GeoAgentBench
higher is better
Data table: GeoAgentBench
GeoAnalystBench
higher is better
Data table: GeoAnalystBench
ThinkGeo
higher is better
Data table: ThinkGeo
OpenEarthAgent
higher is better
Data table: OpenEarthAgent
Earth-Bench V2 images
higher is better
Data table: Earth-Bench V2 images
ThinkGeo images
higher is better
Data table: ThinkGeo images
| Model | Developer | ThinkGeo images |
|---|---|---|
| Claude Opus 5.5 (xhigh) | Anthropic | 47.7 |
| Claude Sonnet 5.5 (xhigh) | Anthropic | 46.5 |
| GPT-6.1 Sol (xhigh) | OpenAI | 40.7 |
| GPT-6 Sol (high) | OpenAI | 40.7 |
| GPT-5.6 Sol (high) | OpenAI | 40.7 |
| Claude Opus 5 (high) | Anthropic | 38.4 |
| GPT-5.6 Luna (xhigh) | OpenAI | 37.2 |
| Qwen 3.8 27B (xhigh) Open weights | Alibaba (Qwen) | 36.7 |
| Claude Haiku 5.5 (xhigh) | Anthropic | 34.9 |
| GPT-6 Luna (xhigh) | OpenAI | 34.9 |
| GLM-5.3-Flash (max) Open weights | Z.ai | 34.9 |
| Claude Opus 4.8 (high) | Anthropic | 33.7 |
| GPT-5.6 Terra (high) | OpenAI | 33.7 |
| Gemini 3.8 Flash (low) | 33.7 | |
| Kimi K2.7 Code (Reasoning) Open weights | Moonshot AI | 31.4 |
| Kimi K3 (Reasoning) Open weights | Moonshot AI | 30.2 |
| Claude Sonnet 5 (high) | Anthropic | 27.9 |
| Kimi K2.6 (Reasoning) Open weights | Moonshot AI | 27.9 |
| Claude Opus 4.7 (high) | Anthropic | 26.7 |
| Gemini 3.1 Flash-Lite (high) | 24.4 | |
| Gemma 4 26B A4B (Reasoning) Open weights | 22.4 | |
| Claude Haiku 4.5 (Reasoning) | Anthropic | 18.6 |
| Mistral Large 3 (Non-reasoning) Open weights | Mistral AI | 15.1 |
| Mistral Small 3.1 24B (Non-reasoning) Open weights | Mistral AI | 11.6 |
Geospatial knowledge
higher is better
Data table: Geospatial knowledge
OGD4All
higher is better
Data table: OGD4All
GeoNatureAgent
higher is better
Data table: GeoNatureAgent
MultiGlobeQA
higher is better
Data table: MultiGlobeQA
GeoAgentEval
higher is better
Data table: GeoAgentEval
Open weights
Earth-Bench V2
higher is better
Data table: Earth-Bench V2
GeoBenchX
higher is better
Data table: GeoBenchX
GS-QA2
higher is better
Data table: GS-QA2
GeoAgentBench
higher is better
Data table: GeoAgentBench
GeoAnalystBench
higher is better
Data table: GeoAnalystBench
ThinkGeo
higher is better
Data table: ThinkGeo
| Model | Developer | ThinkGeo |
|---|---|---|
| Claude Haiku 5.5 (max), Claude Code | Anthropic | 77 |
| GLM-5.3-Flash (max), Claude Code | Z.ai | 74 |
| DeepSeek V4.1 Flash (max), Codex | DeepSeek | 70 |
| GPT-5.6 Terra (high), Codex | OpenAI | 62 |
OpenEarthAgent
higher is better
Data table: OpenEarthAgent
| Model | Developer | OpenEarthAgent |
|---|---|---|
| DeepSeek V4.1 Flash (max), Codex | DeepSeek | 94 |
| Claude Haiku 5.5 (max), Claude Code | Anthropic | 94 |
| GLM-5.3-Flash (max), Claude Code | Z.ai | 88 |
| GPT-5.6 Terra (high), Codex | OpenAI | 88 |
Earth-Bench V2 images
higher is better
Data table: Earth-Bench V2 images
| Model | Developer | Earth-Bench V2 images |
|---|---|---|
| GPT-5.6 Terra (high) | OpenAI | 74.0 |
| Qwen 3.8 27B (xhigh) Open weights | Alibaba (Qwen) | 69.4 |
| Kimi K3 (Reasoning) Open weights | Moonshot AI | 66.0 |
| Gemma 4 26B A4B (Reasoning) Open weights | 64.0 | |
| Kimi K2.6 (Reasoning) Open weights | Moonshot AI | 60.0 |
| Kimi K2.7 Code (Reasoning) Open weights | Moonshot AI | 56.0 |
| Mistral Small 3.1 24B (Non-reasoning) Open weights | Mistral AI | 54.0 |
| GLM-5.3-Flash (max) Open weights | Z.ai | 52.8 |
| Mistral Large 3 (Non-reasoning) Open weights | Mistral AI | 51.5 |
ThinkGeo images
higher is better
Data table: ThinkGeo images
| Model | Developer | ThinkGeo images |
|---|---|---|
| Qwen 3.8 27B (xhigh) Open weights | Alibaba (Qwen) | 36.7 |
| GLM-5.3-Flash (max) Open weights | Z.ai | 34.9 |
| GPT-5.6 Terra (high) | OpenAI | 33.7 |
| Kimi K2.7 Code (Reasoning) Open weights | Moonshot AI | 31.4 |
| Kimi K3 (Reasoning) Open weights | Moonshot AI | 30.2 |
| Kimi K2.6 (Reasoning) Open weights | Moonshot AI | 27.9 |
| Gemma 4 26B A4B (Reasoning) Open weights | 22.4 | |
| Mistral Large 3 (Non-reasoning) Open weights | Mistral AI | 15.1 |
| Mistral Small 3.1 24B (Non-reasoning) Open weights | Mistral AI | 11.6 |
Geospatial knowledge
higher is better
Data table: Geospatial knowledge
| Model | Developer | Geospatial knowledge |
|---|---|---|
| GPT-5.6 Terra (high) | OpenAI | 92.4 |
| Kimi K2.7 Code (Reasoning) Open weights | Moonshot AI | 92.1 |
| Kimi K3 (Reasoning) Open weights | Moonshot AI | 92.0 |
| DeepSeek V4 Pro (max) Open weights | DeepSeek | 91.9 |
| Nemotron 3.5 Super VL 120B (Reasoning) Open weights | NVIDIA | 91.9 |
| GLM-5.3 (max) Open weights | Z.ai | 91.8 |
| Kimi K2.6 (Reasoning) Open weights | Moonshot AI | 91.8 |
| GLM-5.3-Flash (max) Open weights | Z.ai | 91.8 |
| Step 5 Preview (Reasoning) Open weights | StepFun | 91.5 |
| DeepSeek V4 Flash (max) Open weights | DeepSeek | 91.5 |
| Qwen 3.8 27B (xhigh) Open weights | Alibaba (Qwen) | 91.1 |
| Nemotron 3 Ultra (high) Open weights | NVIDIA | 90.8 |
| gpt-oss-120b (high) Open weights | OpenAI | 89.8 |
| Nemotron 3.5 Lightning 30B (Reasoning) Open weights | NVIDIA | 89.8 |
| MiniMax M3.1 Flash (max) Open weights | MiniMax | 89.0 |
| GLM-5.2 (max) Open weights | Z.ai | 89.0 |
| Mistral Large 3 (Non-reasoning) Open weights | Mistral AI | 88.7 |
| Gemma 4 26B A4B (Reasoning) Open weights | 88.7 | |
| GLM-4.7-Flash (Reasoning) Open weights | Z.ai | 85.6 |
| gpt-oss-20b (high) Open weights | OpenAI | 84.8 |
| Nemotron 3 Nano Omni 30B (Reasoning) Open weights | NVIDIA | 84.8 |
| Llama 3.3 70B (Non-reasoning) Open weights | Meta | 82.5 |
| Mistral Small 3.1 24B (Non-reasoning) Open weights | Mistral AI | 81.8 |
OGD4All
higher is better
Data table: OGD4All
| Model | Developer | OGD4All |
|---|---|---|
| Kimi K3 (Reasoning), Kimi Code | Moonshot AI | 97 |
| Claude Haiku 5.5 (max), Claude Code | Anthropic | 97 |
| GLM-5.3 (max), Claude Code | Z.ai | 96 |
| Mistral Large 4 (high), Terminus-2 | Mistral AI | 96 |
| Qwen 3.8 27B (xhigh), Qwen Code | Alibaba (Qwen) | 95 |
| GLM-5.3-Flash (max), Claude Code | Z.ai | 93 |
| Step 5 Preview (Reasoning), Terminus-2 | StepFun | 93 |
| Qwen 3.8 27B (xhigh), Terminus-2 | Alibaba (Qwen) | 92 |
| Nemotron 3 Ultra (high), Terminus-2 | NVIDIA | 92 |
| Nemotron 3.5 Super VL 120B (Reasoning), Terminus-2 | NVIDIA | 91 |
| Nemotron 3.5 Lightning 30B (Reasoning), Terminus-2 | NVIDIA | 90 |
| MiniMax M3.1 Flash (max), Terminus-2 | MiniMax | 88 |
| DeepSeek V4 Flash (high), Claude Code | DeepSeek | 70 |
| Nemotron 3 Nano Omni 30B (Reasoning), Terminus-2 | NVIDIA | 47 |
GeoNatureAgent
higher is better
Data table: GeoNatureAgent
| Model | Developer | GeoNatureAgent |
|---|---|---|
| MiniMax M3.1 Flash (max), Terminus-2 | MiniMax | 100 |
| Mistral Large 4 (high), Terminus-2 | Mistral AI | 100 |
| Qwen 3.8 27B (xhigh), Terminus-2 | Alibaba (Qwen) | 100 |
| GLM-5.3-Flash (max), Claude Code | Z.ai | 100 |
| GLM-5.3 (max), Claude Code | Z.ai | 100 |
| Kimi K3 (Reasoning), Kimi Code | Moonshot AI | 100 |
| Qwen 3.8 27B (xhigh), Qwen Code | Alibaba (Qwen) | 100 |
| Claude Haiku 5.5 (max), Claude Code | Anthropic | 100 |
| Nemotron 3.5 Super VL 120B (Reasoning), Terminus-2 | NVIDIA | 92 |
| Nemotron 3 Ultra (high), Terminus-2 | NVIDIA | 92 |
| Step 5 Preview (Reasoning), Terminus-2 | StepFun | 88 |
| DeepSeek V4 Flash (high), Claude Code | DeepSeek | 71 |
| Nemotron 3.5 Lightning 30B (Reasoning), Terminus-2 | NVIDIA | 64 |
| Nemotron 3 Nano Omni 30B (Reasoning), Terminus-2 | NVIDIA | 0 |
MultiGlobeQA
higher is better
Data table: MultiGlobeQA
| Model | Developer | MultiGlobeQA |
|---|---|---|
| Kimi K3 (Reasoning), Kimi Code | Moonshot AI | 77 |
| Claude Haiku 5.5 (max), Claude Code | Anthropic | 76 |
| GLM-5.3 (max), Claude Code | Z.ai | 74 |
| Qwen 3.8 27B (xhigh), Qwen Code | Alibaba (Qwen) | 74 |
| Nemotron 3.5 Super VL 120B (Reasoning), Terminus-2 | NVIDIA | 73 |
| GLM-5.3-Flash (max), Claude Code | Z.ai | 73 |
| Nemotron 3 Ultra (high), Terminus-2 | NVIDIA | 72 |
| Qwen 3.8 27B (xhigh), Terminus-2 | Alibaba (Qwen) | 71 |
| Step 5 Preview (Reasoning), Terminus-2 | StepFun | 70 |
| Nemotron 3.5 Lightning 30B (Reasoning), Terminus-2 | NVIDIA | 68 |
| MiniMax M3.1 Flash (max), Terminus-2 | MiniMax | 65 |
| DeepSeek V4 Flash (high), Claude Code | DeepSeek | 64 |
| Mistral Large 4 (high), Terminus-2 | Mistral AI | 62 |
| Nemotron 3 Nano Omni 30B (Reasoning), Terminus-2 | NVIDIA | 48 |
GeoAgentEval
higher is better
Data table: GeoAgentEval
| Model | Developer | GeoAgentEval |
|---|---|---|
| GLM-5.3-Flash (max), Claude Code | Z.ai | 96 |
| Kimi K3 (Reasoning), Kimi Code | Moonshot AI | 96 |
| Claude Haiku 5.5 (max), Claude Code | Anthropic | 96 |
| Qwen 3.8 27B (xhigh), Terminus-2 | Alibaba (Qwen) | 92 |
| Nemotron 3 Ultra (high), Terminus-2 | NVIDIA | 92 |
| Step 5 Preview (Reasoning), Terminus-2 | StepFun | 91 |
| GLM-5.3 (max), Claude Code | Z.ai | 88 |
| Qwen 3.8 27B (xhigh), Qwen Code | Alibaba (Qwen) | 88 |
| Nemotron 3.5 Super VL 120B (Reasoning), Terminus-2 | NVIDIA | 80 |
| DeepSeek V4 Flash (high), Claude Code | DeepSeek | 80 |
| MiniMax M3.1 Flash (max), Terminus-2 | MiniMax | 67 |
| Mistral Large 4 (high), Terminus-2 | Mistral AI | 60 |
| Nemotron 3 Nano Omni 30B (Reasoning), Terminus-2 | NVIDIA | 48 |
| Nemotron 3.5 Lightning 30B (Reasoning), Terminus-2 | NVIDIA | 36 |
Cost
All
Cost per task
Average cost per agent task (USD) · Lower is better
How to read this chart
What cost is measuring. What one attempt at a task would cost if paid token by token at the provider's published API prices, averaged over attempts: ordinary input tokens, input tokens served from the provider's cache at the lower cached price, tokens written to the cache where the provider charges for that, and output tokens (thinking included). Cost assumes each harness uses the model's pay-per-token API, priced at public list rates; sandboxes and our own engineering time are not included. Failed attempts count too.
How to read this chart. Lower is better. Costs are pay-per-token list prices, not any discount or credit a customer might have.
Data table: Cost per task
Open weights
Cost per task
Average cost per agent task (USD) · Lower is better
How to read this chart
What cost is measuring. What one attempt at a task would cost if paid token by token at the provider's published API prices, averaged over attempts: ordinary input tokens, input tokens served from the provider's cache at the lower cached price, tokens written to the cache where the provider charges for that, and output tokens (thinking included). Cost assumes each harness uses the model's pay-per-token API, priced at public list rates; sandboxes and our own engineering time are not included. Failed attempts count too.
How to read this chart. Lower is better. Costs are pay-per-token list prices, not any discount or credit a customer might have.
Data table: Cost per task
All
Geospatial Agent Index vs. cost per task
Geospatial Agent Index, Text only; cost per task (USD) · Higher and further left is better
- Most attractive quadrant
- Pareto line
How to read this chart
Why a log scale. Costs and times differ by a factor of ten or more between models, so equal steps on the axis are equal ratios.
Not yet ranked. Entries with too few tasks run so far are not plotted; the table lists them, and every entry is on the models page.
What cost is measuring. What one attempt at a task would cost if paid token by token at the provider's published API prices, averaged over attempts: ordinary input tokens, input tokens served from the provider's cache at the lower cached price, tokens written to the cache where the provider charges for that, and output tokens (thinking included). Cost assumes each harness uses the model's pay-per-token API, priced at public list rates; sandboxes and our own engineering time are not included. Failed attempts count too.
How to read this chart. Each point is one entry. Further left means a lower average cost per task (log scale); higher means a higher Geospatial Agent Index. Both axes fit the models shown, so the score axis does not start at zero. The shaded most attractive quadrant is the top-left quarter of the plot, split at the middle of each axis: a reading aid that moves with the axes when you change the models shown, not a fixed bar. The dotted Pareto line joins the shown models that no cheaper shown model beats on score.
Data table: Geospatial Agent Index vs. cost per task
Open weights
Geospatial Agent Index vs. cost per task
Geospatial Agent Index, Text only; cost per task (USD) · Higher and further left is better
- Most attractive quadrant
- Pareto line
How to read this chart
Why a log scale. Costs and times differ by a factor of ten or more between models, so equal steps on the axis are equal ratios.
What cost is measuring. What one attempt at a task would cost if paid token by token at the provider's published API prices, averaged over attempts: ordinary input tokens, input tokens served from the provider's cache at the lower cached price, tokens written to the cache where the provider charges for that, and output tokens (thinking included). Cost assumes each harness uses the model's pay-per-token API, priced at public list rates; sandboxes and our own engineering time are not included. Failed attempts count too.
How to read this chart. Each point is one entry. Further left means a lower average cost per task (log scale); higher means a higher Geospatial Agent Index. Both axes fit the models shown, so the score axis does not start at zero. The shaded most attractive quadrant is the top-left quarter of the plot, split at the middle of each axis: a reading aid that moves with the axes when you change the models shown, not a fixed bar. The dotted Pareto line joins the shown models that no cheaper shown model beats on score.
Data table: Geospatial Agent Index vs. cost per task
Time
All
Time per task
Average minutes per agent task, at 100 output tokens/s · Lower is better
How to read this chart
What this metric means. Time as if every model wrote 100 output tokens per second: output tokens divided by 100, plus the time the agent's commands took. Serving speed differs between providers and is not ranked.
Data table: Time per task
Open weights
Time per task
Average minutes per agent task, at 100 output tokens/s · Lower is better
How to read this chart
What this metric means. Time as if every model wrote 100 output tokens per second: output tokens divided by 100, plus the time the agent's commands took. Serving speed differs between providers and is not ranked.
Data table: Time per task
All
Geospatial Agent Index vs. time per task
Geospatial Agent Index, Text only; time per task (minutes) · Higher and further left is better
- Most attractive quadrant
- Pareto line
How to read this chart
Why a log scale. Costs and times differ by a factor of ten or more between models, so equal steps on the axis are equal ratios.
What this metric means. Time as if every model wrote 100 output tokens per second: output tokens divided by 100, plus the time the agent's commands took. Serving speed differs between providers and is not ranked.
Not yet ranked. Entries with too few tasks run so far are not plotted; the table lists them, and every entry is on the models page.
How to read this chart. Each point is one entry. Further left means a lower average time per task (log scale); higher means a higher Geospatial Agent Index. Both axes fit the models shown, so the score axis does not start at zero. The shaded most attractive quadrant is the top-left quarter of the plot, split at the middle of each axis: a reading aid that moves with the axes when you change the models shown, not a fixed bar. The dotted Pareto line joins the shown models that no faster shown model beats on score.
Data table: Geospatial Agent Index vs. time per task
Open weights
Geospatial Agent Index vs. time per task
Geospatial Agent Index, Text only; time per task (minutes) · Higher and further left is better
- Most attractive quadrant
- Pareto line
How to read this chart
Why a log scale. Costs and times differ by a factor of ten or more between models, so equal steps on the axis are equal ratios.
What this metric means. Time as if every model wrote 100 output tokens per second: output tokens divided by 100, plus the time the agent's commands took. Serving speed differs between providers and is not ranked.
How to read this chart. Each point is one entry. Further left means a lower average time per task (log scale); higher means a higher Geospatial Agent Index. Both axes fit the models shown, so the score axis does not start at zero. The shaded most attractive quadrant is the top-left quarter of the plot, split at the middle of each axis: a reading aid that moves with the axes when you change the models shown, not a fixed bar. The dotted Pareto line joins the shown models that no faster shown model beats on score.
Data table: Geospatial Agent Index vs. time per task
Tokens
All
Output tokens per task
Average output tokens per agent task, reasoning included · Lower is better
How to read this chart
Output tokens per task. The average number of tokens the model wrote per attempt, its reasoning included, as reported by the provider.
Compare with care. Models use different tokenisers, so the same text is a different number of tokens for different models. Use token counts to see how much work each model did, and cost to compare spending.
Data table: Output tokens per task
Open weights
Output tokens per task
Average output tokens per agent task, reasoning included · Lower is better
How to read this chart
Output tokens per task. The average number of tokens the model wrote per attempt, its reasoning included, as reported by the provider.
Compare with care. Models use different tokenisers, so the same text is a different number of tokens for different models. Use token counts to see how much work each model did, and cost to compare spending.
Data table: Output tokens per task
All
Turns per task
Average agent turns per task · Lower is better
How to read this chart
What this metric means. A turn is one model reply plus the commands it ran.
Data table: Turns per task
Open weights
Turns per task
Average agent turns per task · Lower is better
How to read this chart
What this metric means. A turn is one model reply plus the commands it ran.
Data table: Turns per task
Side by side
| Metric | Claude Haiku 5.5 (max), Claude Code | GPT-5.6 Terra (high), Codex |
|---|---|---|
| Geospatial Agent Index: Text only | 78 | 69 |
| Geospatial Agent Index: Text + vision | 79 | 69 |
| Earth-Bench V2 score | 70 | 62 |
| GeoBenchX score | 78 | 67 |
| GS-QA2 score | 87 | 80 |
| Vision agents score | 81 | 69 |
| GeoAgentBench score (Guided workflows; not in the Agent Index) | 97 | 96 |
| GeoAnalystBench score (Guided workflows; not in the Agent Index) | 100 | 95 |
| OGD4All score (standalone; in no index) | 97 | No data |
| GeoNatureAgent score (standalone; in no index) | 100 | No data |
| MultiGlobeQA score (standalone; in no index) | 76 | No data |
| GeoAgentEval score (standalone; in no index) | 96 | No data |
| Remote sensing and raster analysis score | 77 | 76 |
| GIS analysis score | 91 | 77 |
| Climate and time series score | 76 | 61 |
| Spatial statistics score | 45 | 46 |
| Making maps score | 85 | 74 |
| Recognising infeasible requests score | 86 | 60 |
| Cost per task | $0.079 | $0.10 |
| Time per task (at 100 output tokens/s) | 7.8 min (estimated) | 0.8 min |
| Tokens per attempt | 859k | 162k |
| Turns per attempt | 13.1 | 9.6 |
| Input price per 1M tokens | $0.10 | $2.00 |
| Output price per 1M tokens | $0.50 | $12.00 |
| Context window | 1,000,000 | 1,050,000 |
| Image input | Yes | Yes |
| Developer | Anthropic | OpenAI |