
We trained a small object-detection model (RF-DETR) to find tents and buildings in satellite imagery. The starting point was the labels: we used Astra to help draw bounding boxes on image crops, reviewed them in Roboflow and then trained the detector. This article walks through that process and what happened when we tried the model on other scenes.
We started with tents in Gaza, added buildings, and then added a small set of Sudan samples. We wanted to see whether this was a practical way to get a detector working, and how far it would carry over to other imagery.
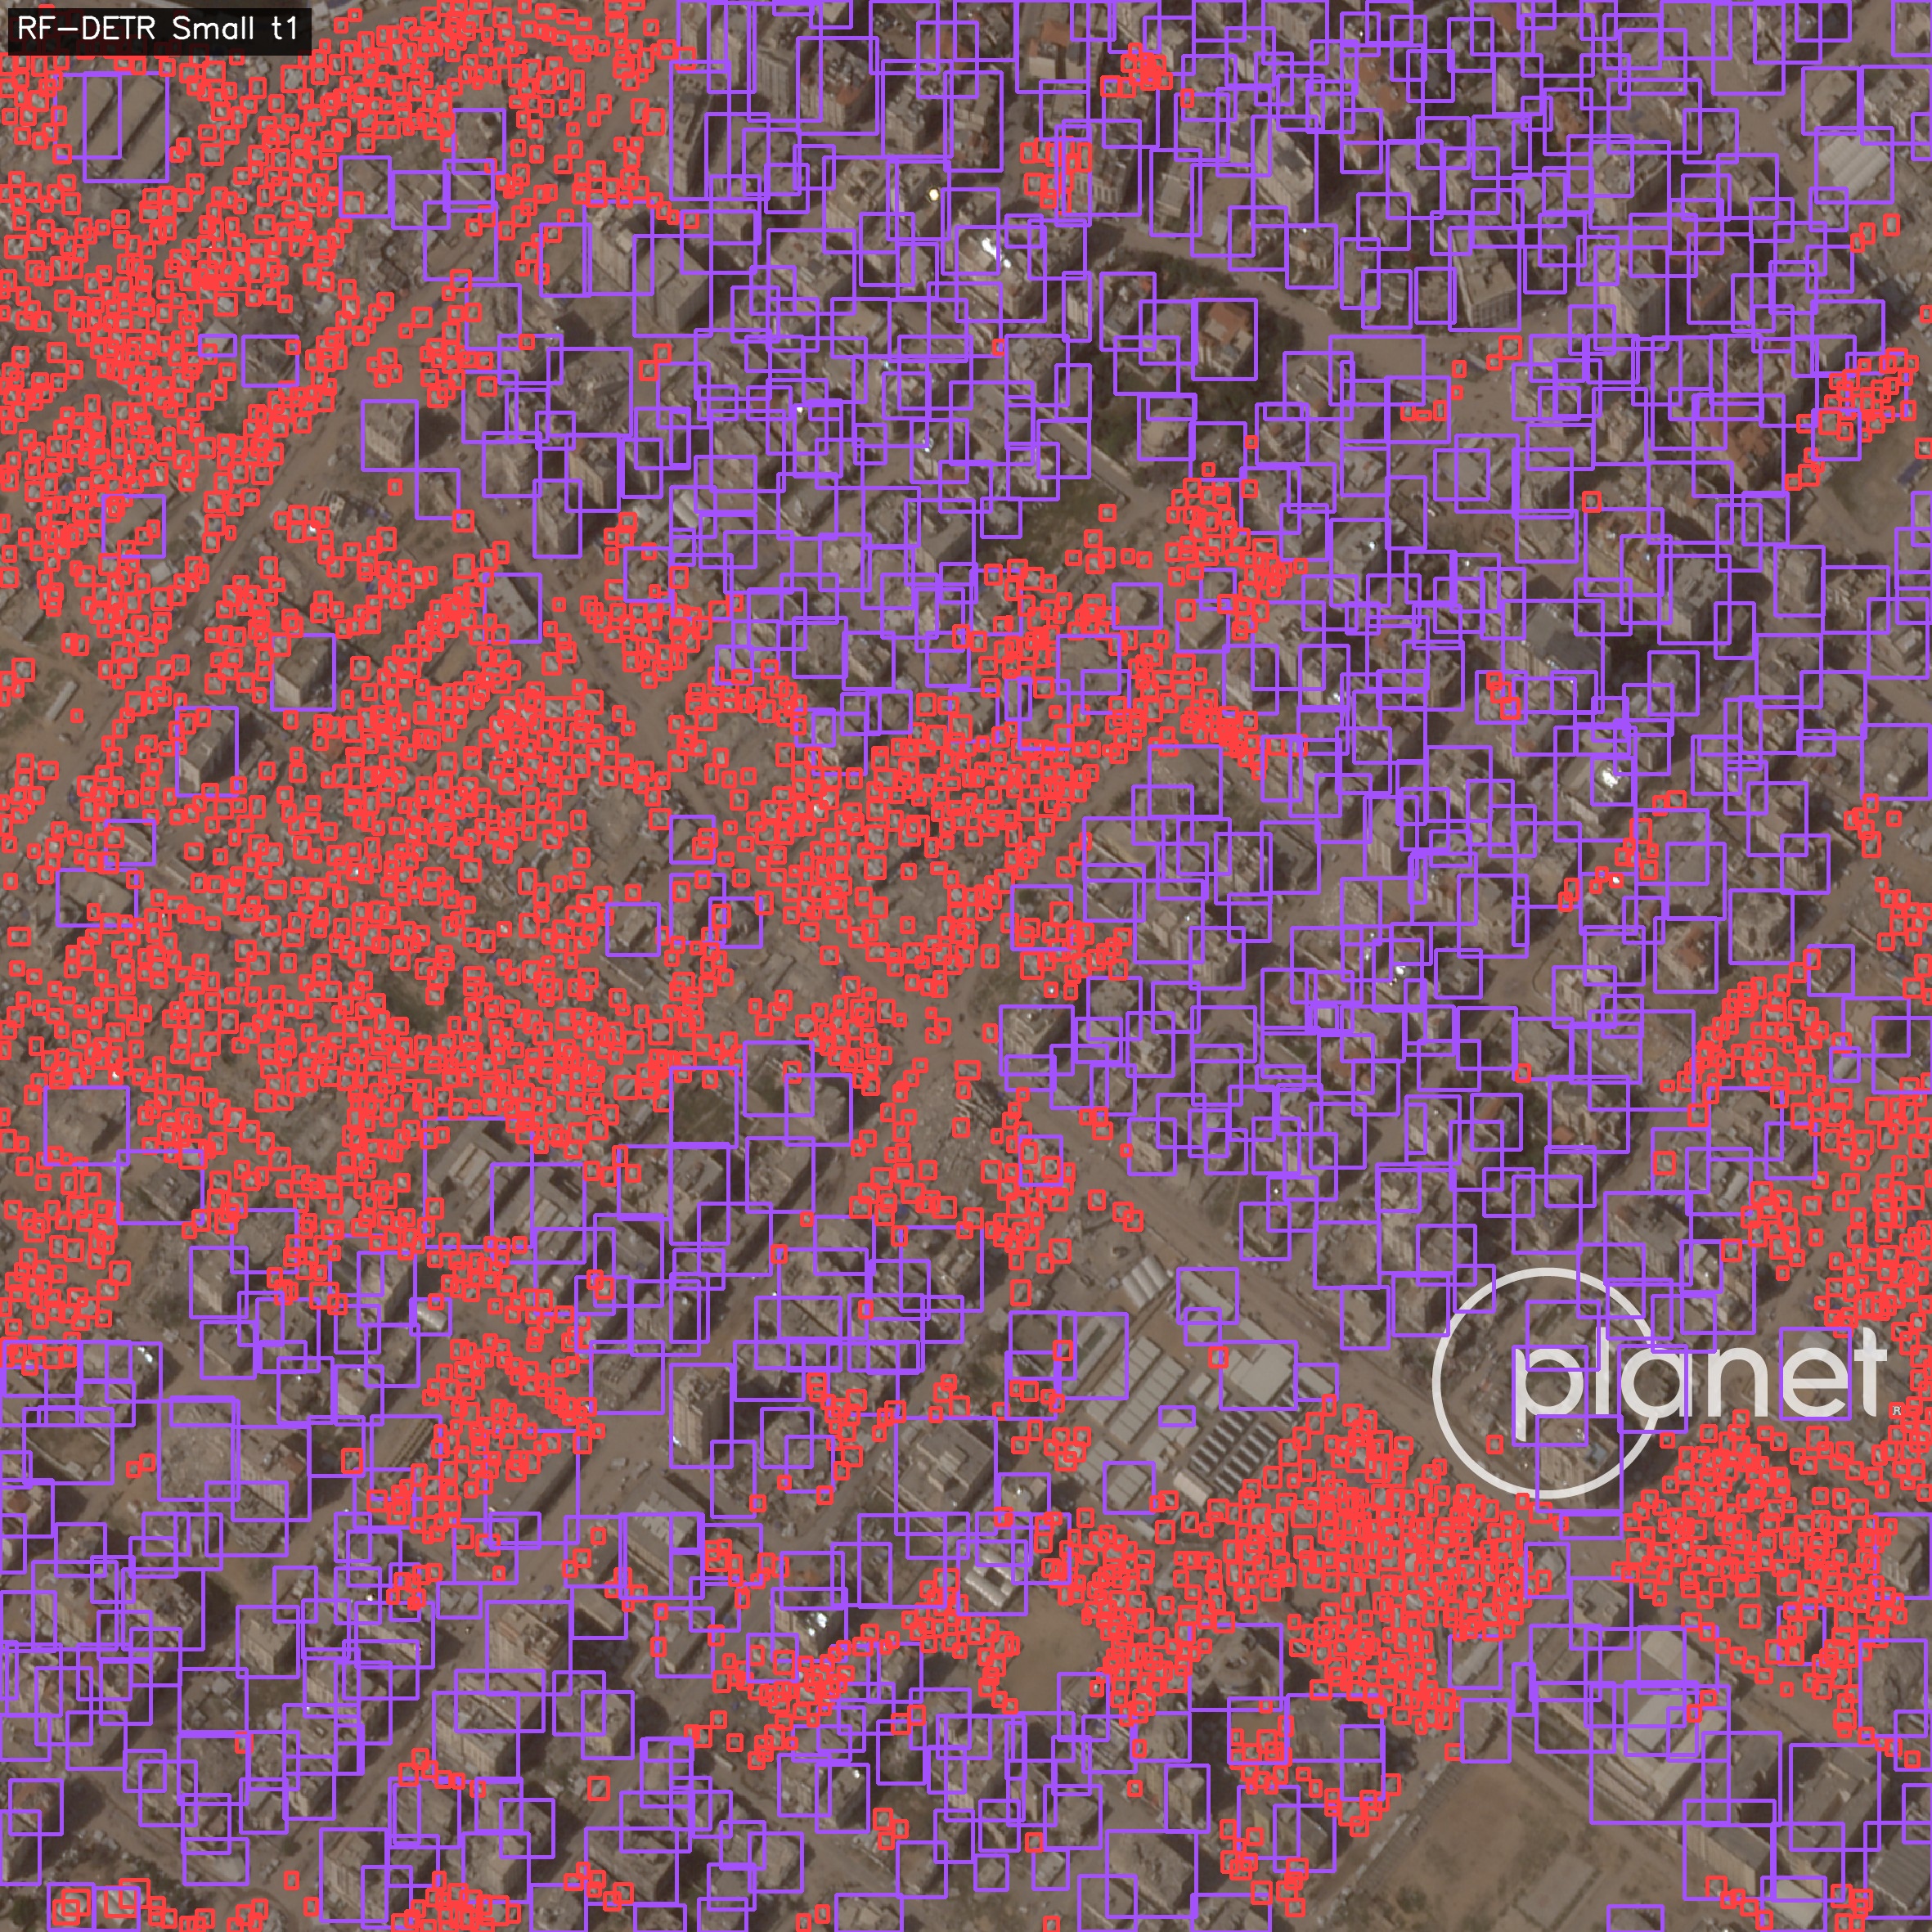
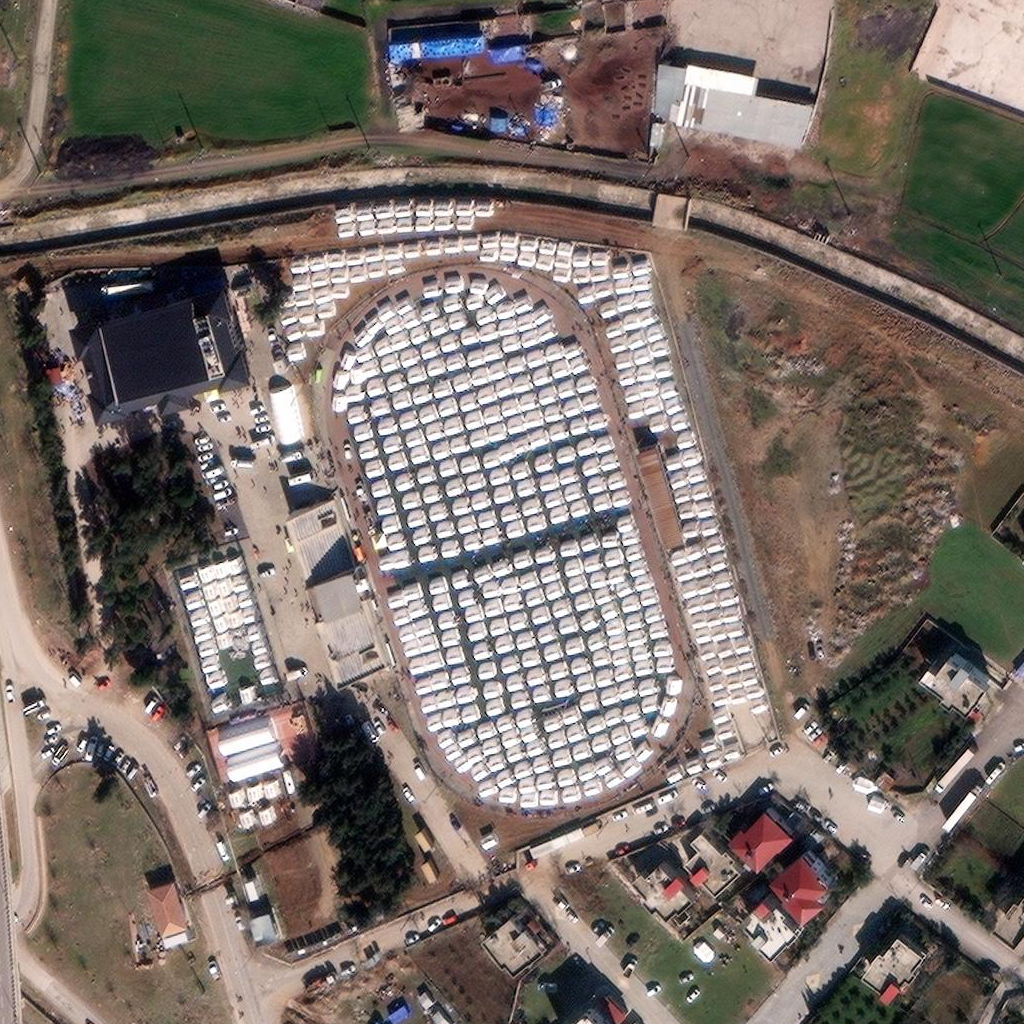
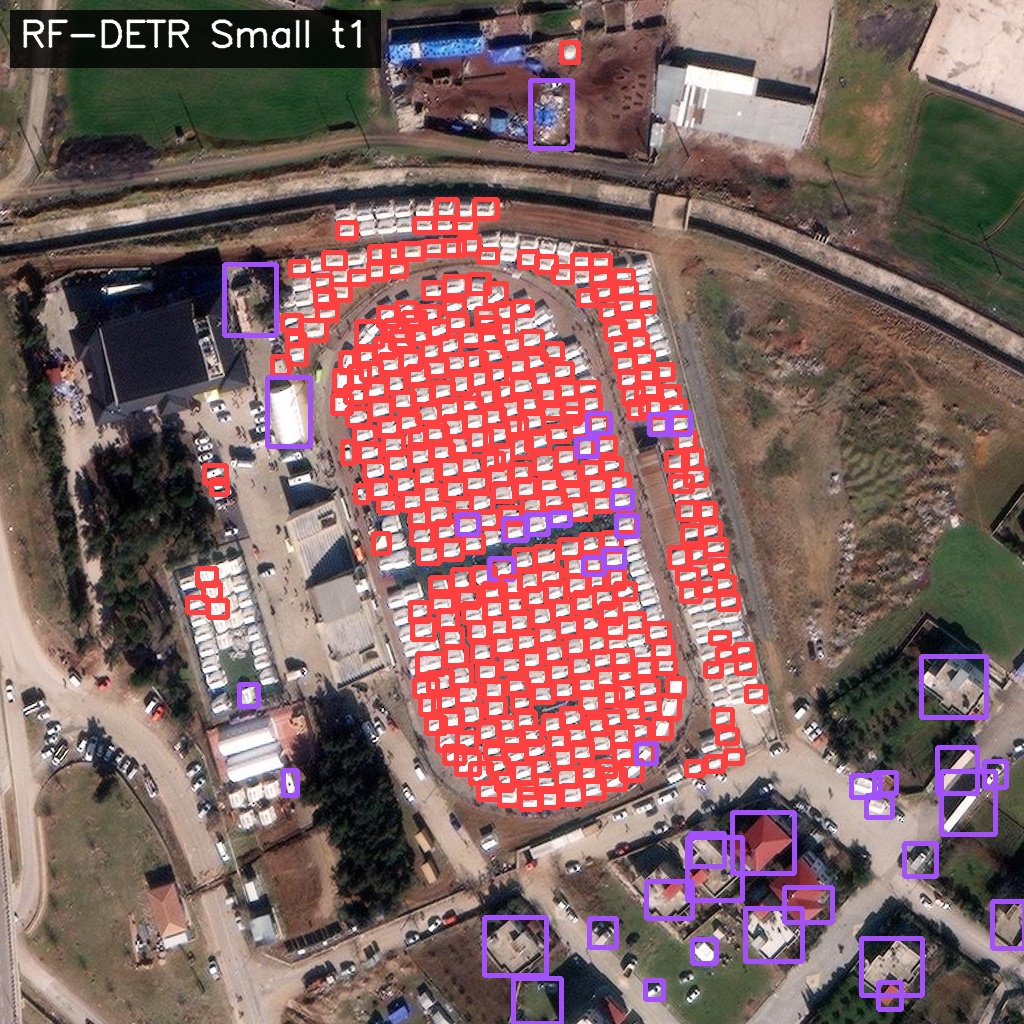
The stadium result later in this article gives an idea of what worked. The model picked up many rows of tents in İslahiye, Turkey, outside the training geography. It also missed tents and sometimes labelled tent-like structures as buildings. This was a small capability test. It gave us a working pipeline and some useful results, but also showed where the data and processing needed more attention.
The workflow is straightforward:
- Prepare clean crops where the objects are visible.
- Ask an image-capable LLM for labels in a defined coordinate format.
- Draw the labels back onto the images and review them.
- Freeze the dataset and train a smaller object-detection model.
- Run it on other imagery and inspect the mistakes.
You can start by uploading image crops to ChatGPT and using an image-capable model available on your account. Model access and usage limits depend on your subscription; hosted training and separate API integrations have their own billing. Our experiment used satellite imagery. The same workflow can be tried with aerial imagery, but we did not test that here.
Preparing the image crops
A large scene can contain thousands of small objects. Asking an LLM to label all of them at once makes omissions hard to spot. We used smaller crops so we could inspect individual tents and roofs.
Keep a clean copy of each crop and record its pixel dimensions. Decide what one object means before labelling. For tents, we wanted a box around each individual visible tent. For buildings, we labelled the visible roof. Attached structures, shadows and uncertain covers need a consistent rule.
These definitions matter later. A roof box is not a precise building footprint, and a tent detection does not tell you how many people live there.
Generating labels with ChatGPT
ChatGPT accepts image inputs. Upload the crop and ask for structured coordinates that you can draw and export. A description such as “many tents on the left” is useful for interpretation, but it is not a training annotation.
Here is a prompt you can adapt. We wrote it for this tutorial; it is not the exact prompt used in the pilot:
Annotate individual visible tents and buildings in this image. Use the supplied image's pixel dimensions. Put the origin at the top left, with x increasing rightward and y downward. Return JSON containing image_width, image_height, objects and uncertain_objects. For each object, give class_name and bbox_xyxy as [left, top, right, bottom]. Keep boxes within the image. Exclude vehicles, shadows and walls. Mark ambiguous structures as uncertain rather than forcing a class. Do not assume the annotation is exhaustive.
Draw the returned boxes onto the exact input image. Check their positions, boundaries and classes, and look for visible objects that have no box. Also check the dimensions: coordinates based on a resized preview can be wrong when applied to the source image.
If the model returns JSON, save it and convert it to the format your annotation tool accepts. COCO stores boxes as [x, y, width, height]; the prompt above asks for [left, top, right, bottom], so the coordinates need conversion. Our companion repository includes a converter that checks geometry and review status before exporting labels.
Our tent labels also had a starting source: prediction markers from TentNetFA. Astra helped refine or reject those candidates and identify additional instances. Building annotations came from the clean imagery. This is part of the method, and it means the tent labels were not an independent reading of the scene.
Reviewing the labels
We brought the images and annotations into Roboflow for review. Upload the clean images as training inputs; keep the coloured overlays for inspection.
The main checks are missing objects, false positives, duplicate boxes and inconsistent boundaries. Empty crops need review too. No annotations can mean there are no objects, or that the labelling is unfinished. If a visible object remains unlabelled, training may treat it as background.
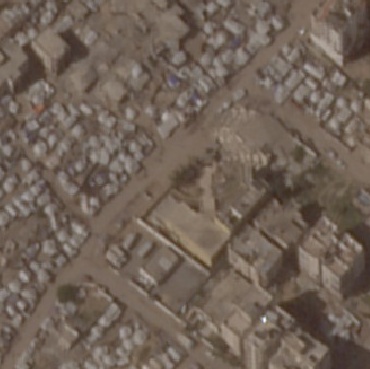
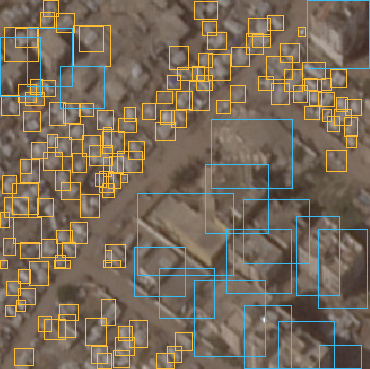
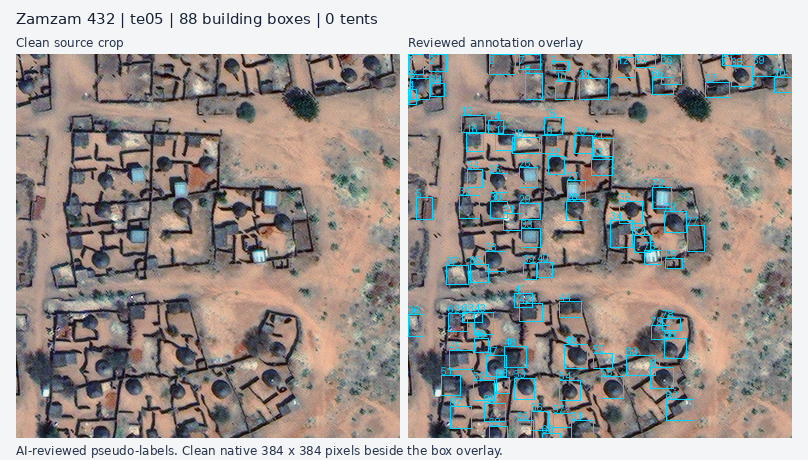
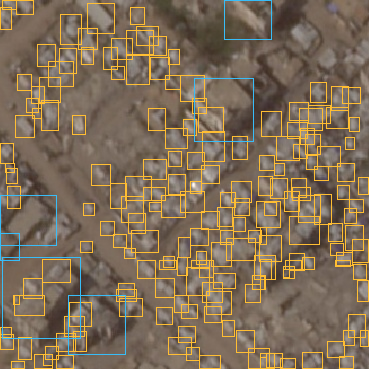
The annotation examples below show a Gaza training crop with 131 tent boxes and 17 building boxes, followed by a Sudan test crop with 88 building reference boxes. These are labels used for training or evaluation, not detections made by the trained model. The labels are AI-reviewed pseudo-labels. A second AI review can help find errors, but it does not make them independently validated human ground truth.
INPUT · Gaza training crop
LABELS · AI-reviewed Gaza annotations
LABELS · Sudan test reference
Roboflow also offers an Auto Label integration with Astra. You can try that route, or start in ChatGPT and bring the labels into a review tool. The integration is optional, and separate from an ordinary ChatGPT subscription.
Training a small object-detection model
We first trained a small detector on 36 Gaza image crops containing 3,421 tent boxes. For this run we used the Nano version of RF-DETR. On four reserved Gaza crops it reported AP50 of 56.1%. External examples showed some useful tent detections, but also missed rows and false detections on roofs. In the Amizmiz, Morocco output, ordinary roof features were labelled as tents.
That led to the next question: would explicitly labelling buildings help the model distinguish them from tents?
We added 523 building boxes while preserving the Gaza images, tent annotations and splits. We trained the Nano model again with both classes, then tried a larger version, RF-DETR Small, trained through Roboflow's hosted service. The earlier Small evaluation reported tent AP50 of 60.8% and building AP50 of 74.7%.
Those results supported continuing the experiment, but did not prove that adding buildings alone improved tent detection. Model capacity and input settings changed too. The Gaza test also had only 19 building references, and the joint Nano's provider-panel scores came from a different evaluation display.
INPUT · Familiar Gaza scene
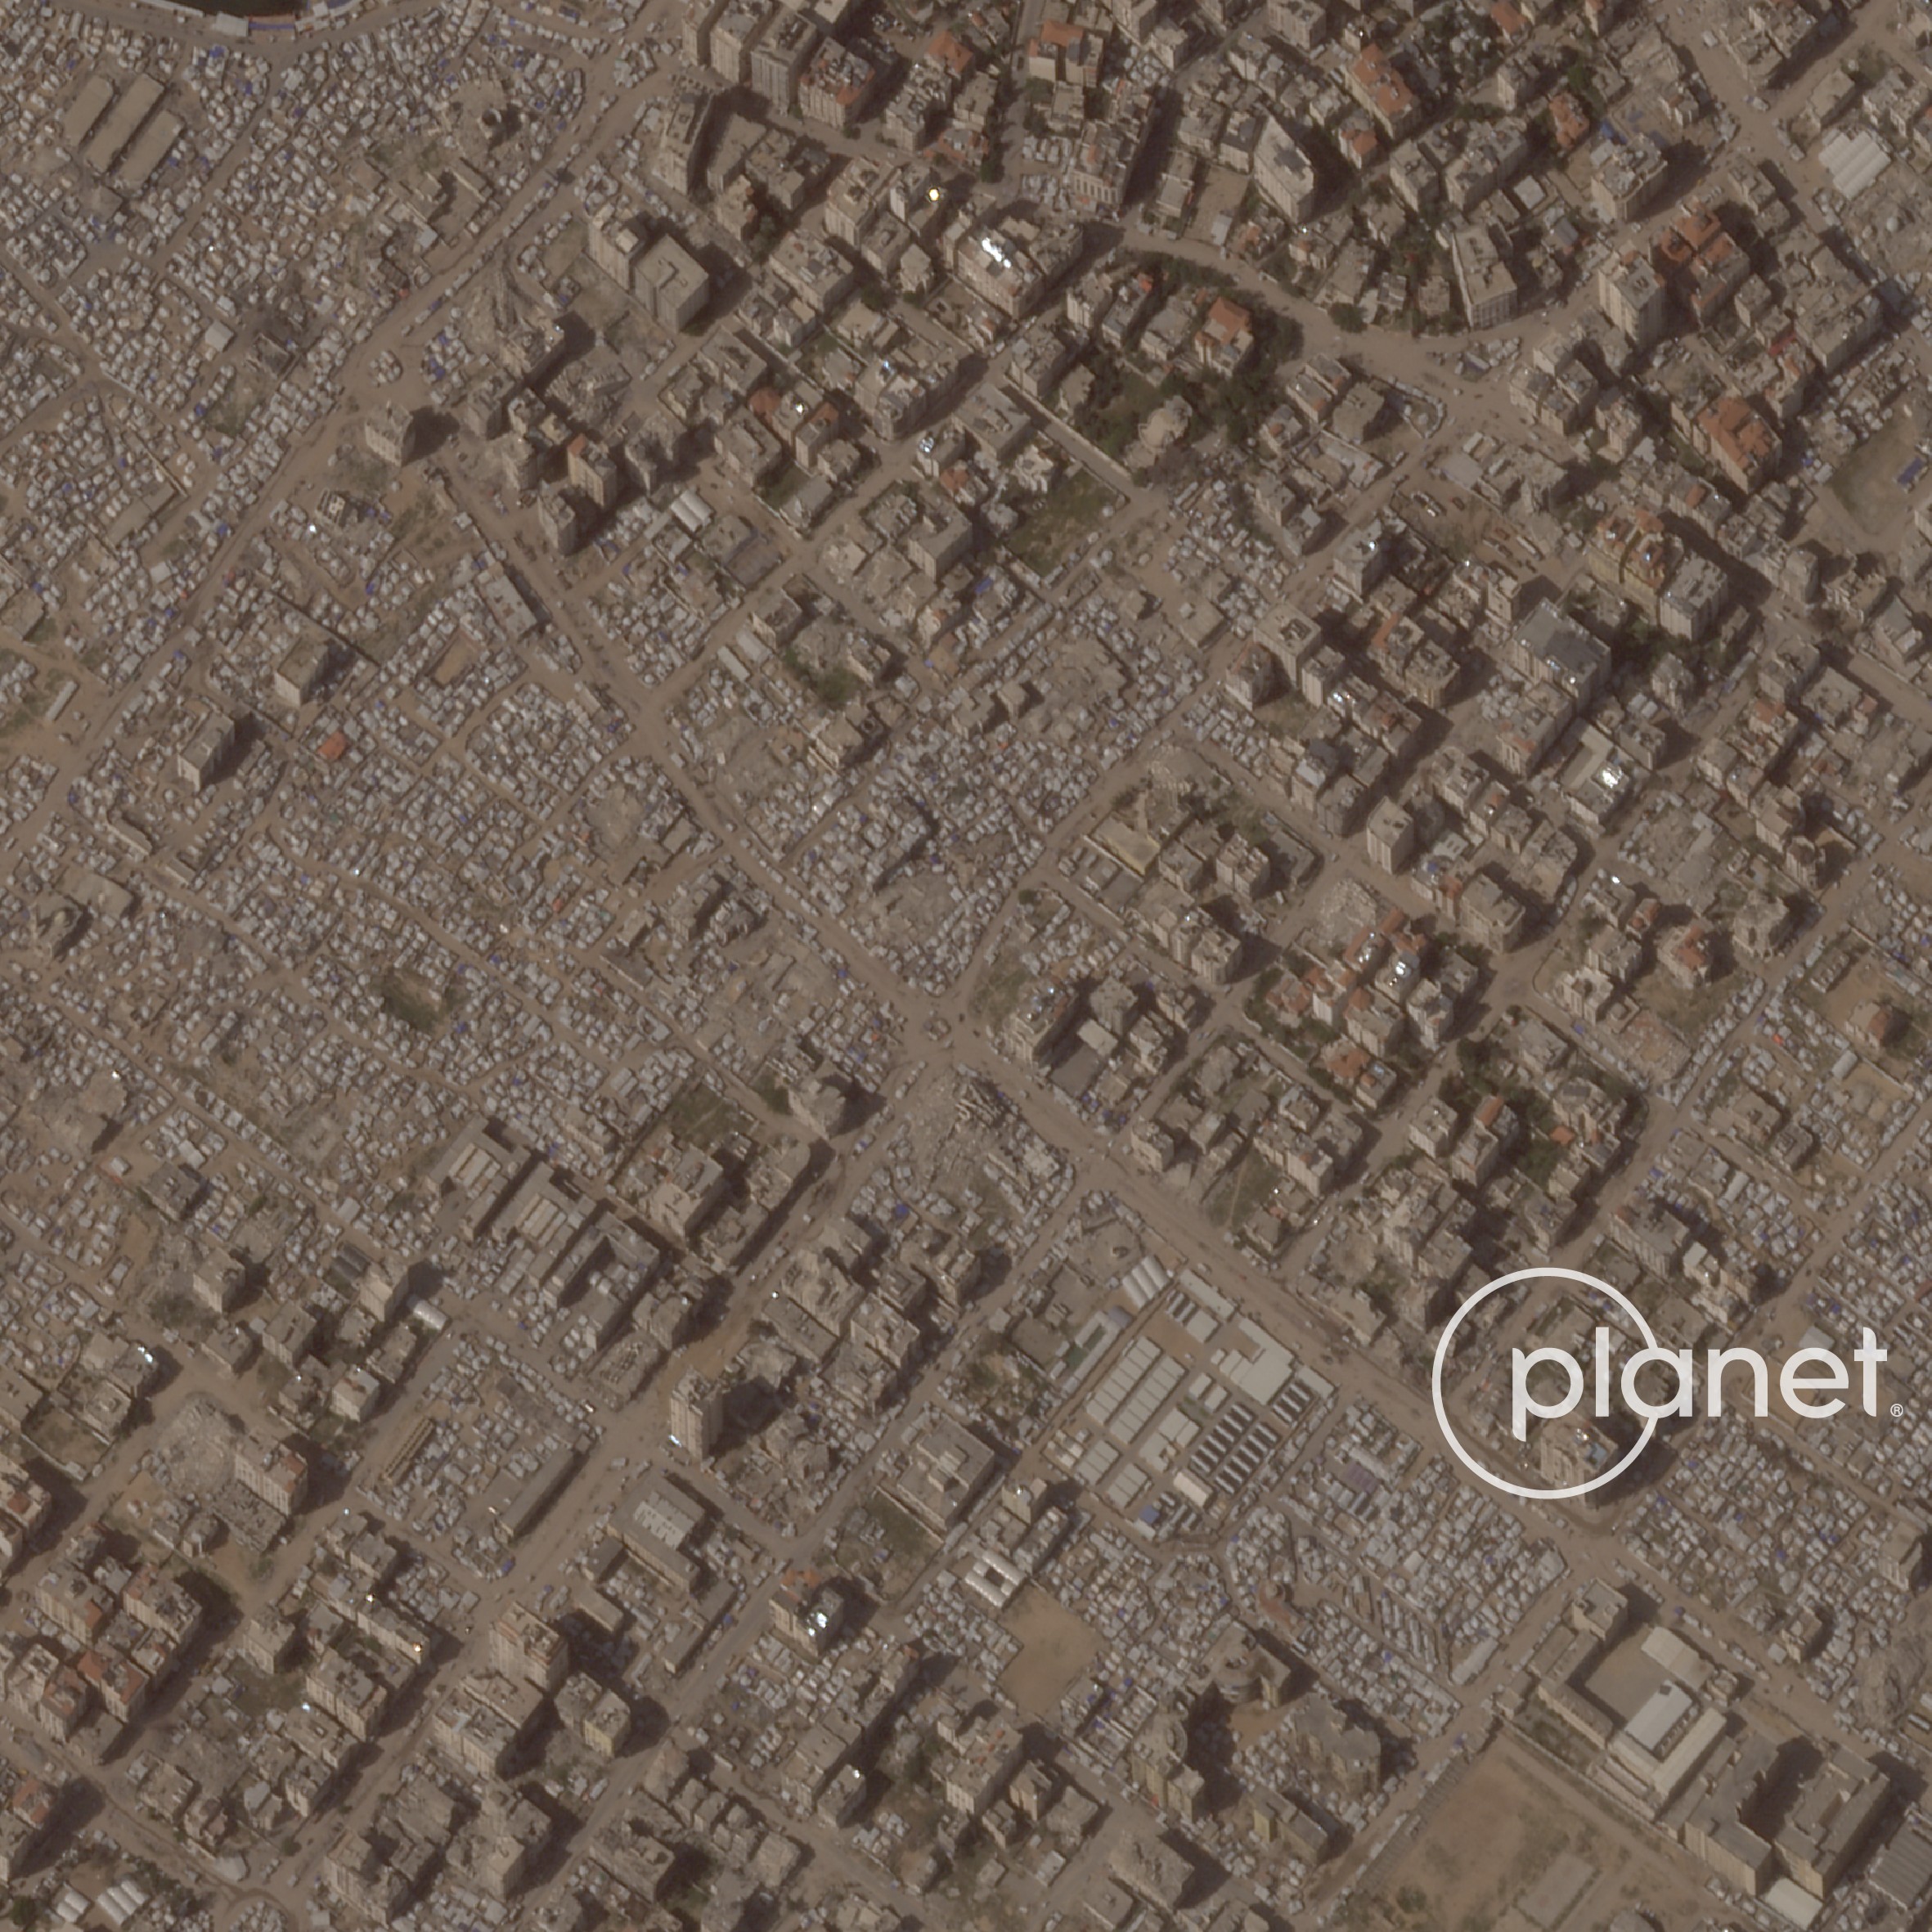
MODEL DETECTIONS · Gaza
INPUT · Turkey stadium
MODEL DETECTIONS · Turkey stadium
Adding building examples from Sudan
We next added Sudan samples to explore different roof forms, settlement layouts and image appearance. Existing building-footprint predictions supplied candidates for review. We accepted nine complete crops with 310 building boxes, including reviewed empty crops. We could not assign defensible tent positives, so we kept this addition building-only.
Four Sudan crops with 70 buildings entered training; two with 148 buildings entered validation; three with 92 buildings entered testing. Each split included a reviewed empty crop. The final hosted dataset had 45 images: 32 for training, six for validation and seven for testing, containing 3,421 tent boxes and 833 building boxes.
The model used auto-orientation and stretch resizing to 512 × 512. A later checkpoint export recorded seed 42 and multi-scale training. The dataset manifest listed no generated augmentation. Training-time transforms and dataset augmentation are separate, and we have not recovered the complete original training recipe.
Thousands of boxes in nearby crops still give you limited scene diversity. Keep overlapping crops together when splitting data, and reserve different sites or acquisitions where possible. Once Sudan samples entered training, the reserved Sudan crops tested adaptation within that geography. Turkey remained an external qualitative example.
Training results
These were exploratory runs. Classes, model settings and test populations changed across the sequence, so the table records what happened rather than ranking the models.
| Experiment | Tent AP50 | Building AP50 | Combined AP50 | Test imagery |
|---|---|---|---|---|
| Tent-only RF-DETR Nano | 56.1% | Not trained | 56.1% | Four Gaza crops |
| Earlier joint RF-DETR Small | 60.8% | 74.7% | 67.7% | Four Gaza crops |
| Final Gaza + Sudan RF-DETR Small | 57.8% | 27.5% | 42.65% | Seven Gaza/Sudan crops |
AP50 measures average precision with a box-overlap matching threshold of 0.5. Here it measures agreement with our AI-reviewed references, rather than independent real-world accuracy.
The final combined score fell, but the building test also changed from 19 references to 111, including 92 from Sudan. We would need both checkpoints on the same independently labelled, domain-separated scenes to measure adaptation or a loss of Gaza performance. Those paired results were not retained.
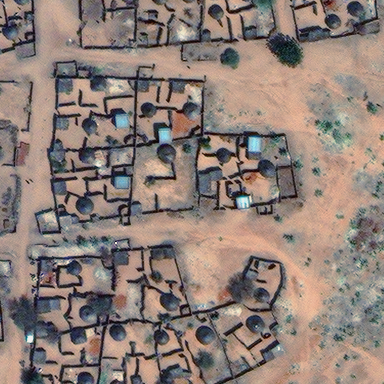
The Sudan output still exposed a practical problem. Many small structures had no detection, while some large building boxes covered apparent open ground or vegetation. Adding a small amount of target imagery had not established reliable extraction.
View the Sudan scene detection errors
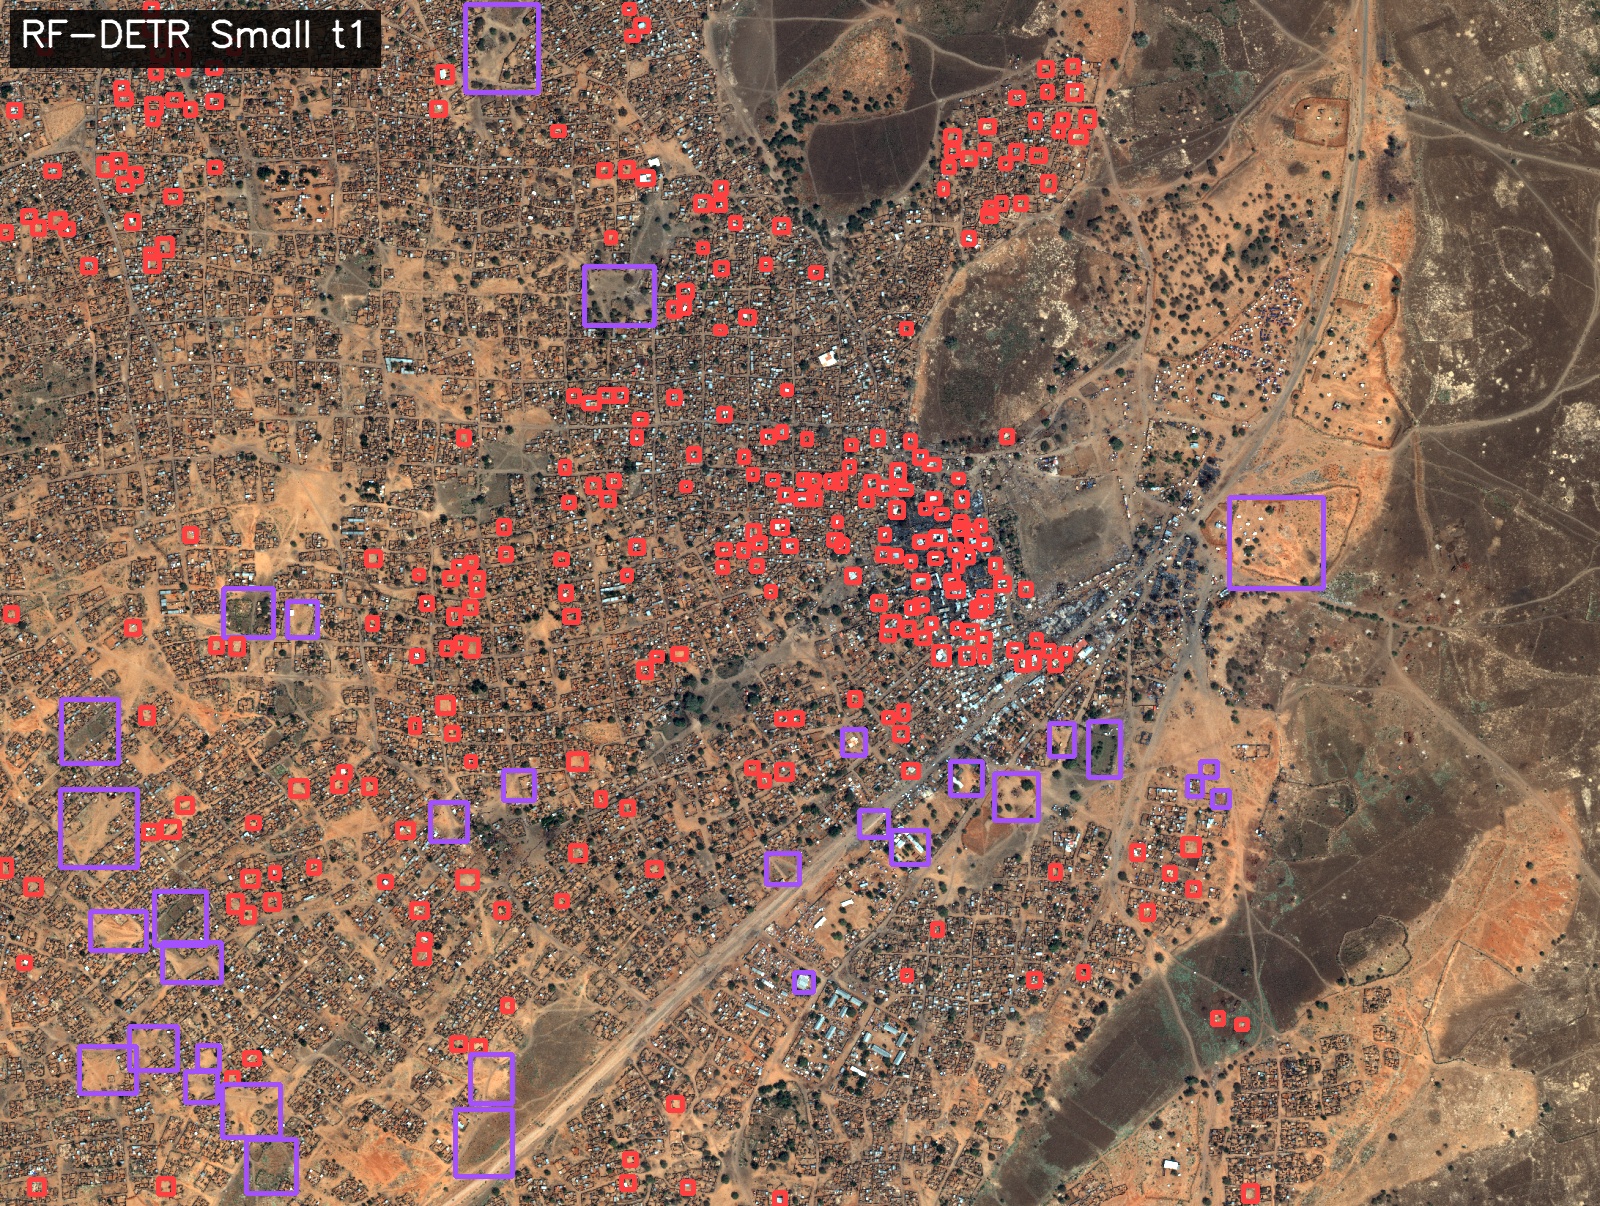
The final mixed model still missed many small structures and produced apparent background false detections. Red: predicted tents; purple: predicted buildings. No successful African transfer is inferred from this image.
View the weaker single-crop result
INPUT · Sudan test crop
MODEL DETECTIONS · Weak Sudan crop result
The Sudan building test was concentrated: one crop held 88 of its 92 building references. There is no separate Africa-only AP or recall result, and no accepted positive Sudan tent references from which to measure tent recall. The lesson is to inspect the scene and the reference support alongside the score.
Running detection on image tiles
For scene detection, we sliced imagery into 512 × 512 source-pixel tiles with 20% overlap, ran detection and stitched the boxes into the original coordinates. Confidence and duplicate-suppression IoU were both 0.30. These were our settings; another object scale or image source needs its own check.
On 7 October we tested input preparation more directly. We kept the final model and thresholds fixed and compared a whole-area pass with 512-pixel and 384-pixel tiles on two native 2,064 × 2,064 Sudan areas.
The cached Zamzam PNG looked much brighter than the training crops. We recovered the recorded display conversion from the original TIFF and reproduced a retained training-style crop exactly. On that matched rendering, the results were:
| Input | Whole-area building candidates | Stitched 512px tiles | Stitched 384px tiles |
|---|---|---|---|
| Zamzam, training-matched rendering | 7 | 700 | 567 |
| Hospital PNG | 0 | 20 | 66 |
INPUT · Zamzam detail
MODEL DETECTIONS · 512px tiles, stitched
Many of the added Zamzam boxes followed small roofs, although misses and uncertain predictions remained. These are candidate totals, not verified building counts or recall. Zamzam is also in the adapted training geography, so this is a processing diagnostic rather than an independent transfer benchmark.
The hospital image showed why tiling is only part of the solution. It still produced tent-class boxes on roof-like urban structures. The whole-area pass returned 133 tent candidates; the two tiled runs returned 47 and 136. More detail changed the output without resolving the class confusion.
At inference, match deterministic preparation: band selection, display conversion, orientation and resizing. Slice before resizing a large scene so that small objects retain useful detail. Random augmentation belongs to training and is not normally repeated for each inference image. These checks show that preparation affects the result; they do not prove that cropping caused every earlier failure.
Detecting individual tents in dense camps
Dense camps create two different overlap problems. Evaluation compares a prediction with a reference box. Duplicate suppression compares predictions with one another. Two boxes can overlap and still represent two different tents.
Keep the label definition consistent: one box per visible tent, with a clear rule for ropes and shadows. Flag cases you cannot separate confidently. A box around a whole row does not replace individual annotations.
The local RF-DETR model returned scored boxes without an additional duplicate-removal step, known as non-maximum suppression (NMS). Our scene-processing workflow applied NMS when merging overlapping tiles. Save raw per-tile predictions and tile IDs so you can tell whether a tent was never predicted or was removed during stitching.
At an NMS IoU threshold of 0.30, a lower-scoring box can be suppressed when it overlaps another box sufficiently. That can remove a duplicate, but may also remove a neighbouring tent. We did not save the original scene predictions before this step, so we cannot measure how many misses it caused.
We tried a small check on one familiar Gaza crop. The final local checkpoint returned 113 tent candidates at confidence 0.30. Applying class-aware NMS afterwards retained 109 at IoU 0.30, 110 at 0.50 and all 113 at 0.70. This shows that the threshold changes which boxes remain. It does not tell us which were correct, and the check had no tile stitching.
For a fuller test, freeze the image, checkpoint, scale and confidence floor. Compare raw and stitched predictions at different suppression thresholds, inspect dense rows and seams, and select the policy using validation scenes. Use global position and tile provenance to remove repeated detections of the same object. Increasing an NMS threshold cannot recover a tent the detector never proposed.
Keep AP50 and AP50:95 for reporting. Small boxes are sensitive to boundary errors: shifting a 10 × 10 box two pixels horizontally gives IoU about 0.67. That passes 0.50 and fails 0.75. If the task is counting, add separately defined one-to-one centre matching, precision/recall and scene count error. Counts alone can hide misses balanced by false positives. We did not evaluate those alternatives or instance masks in this pilot.
From TentNetFA predictions to training labels
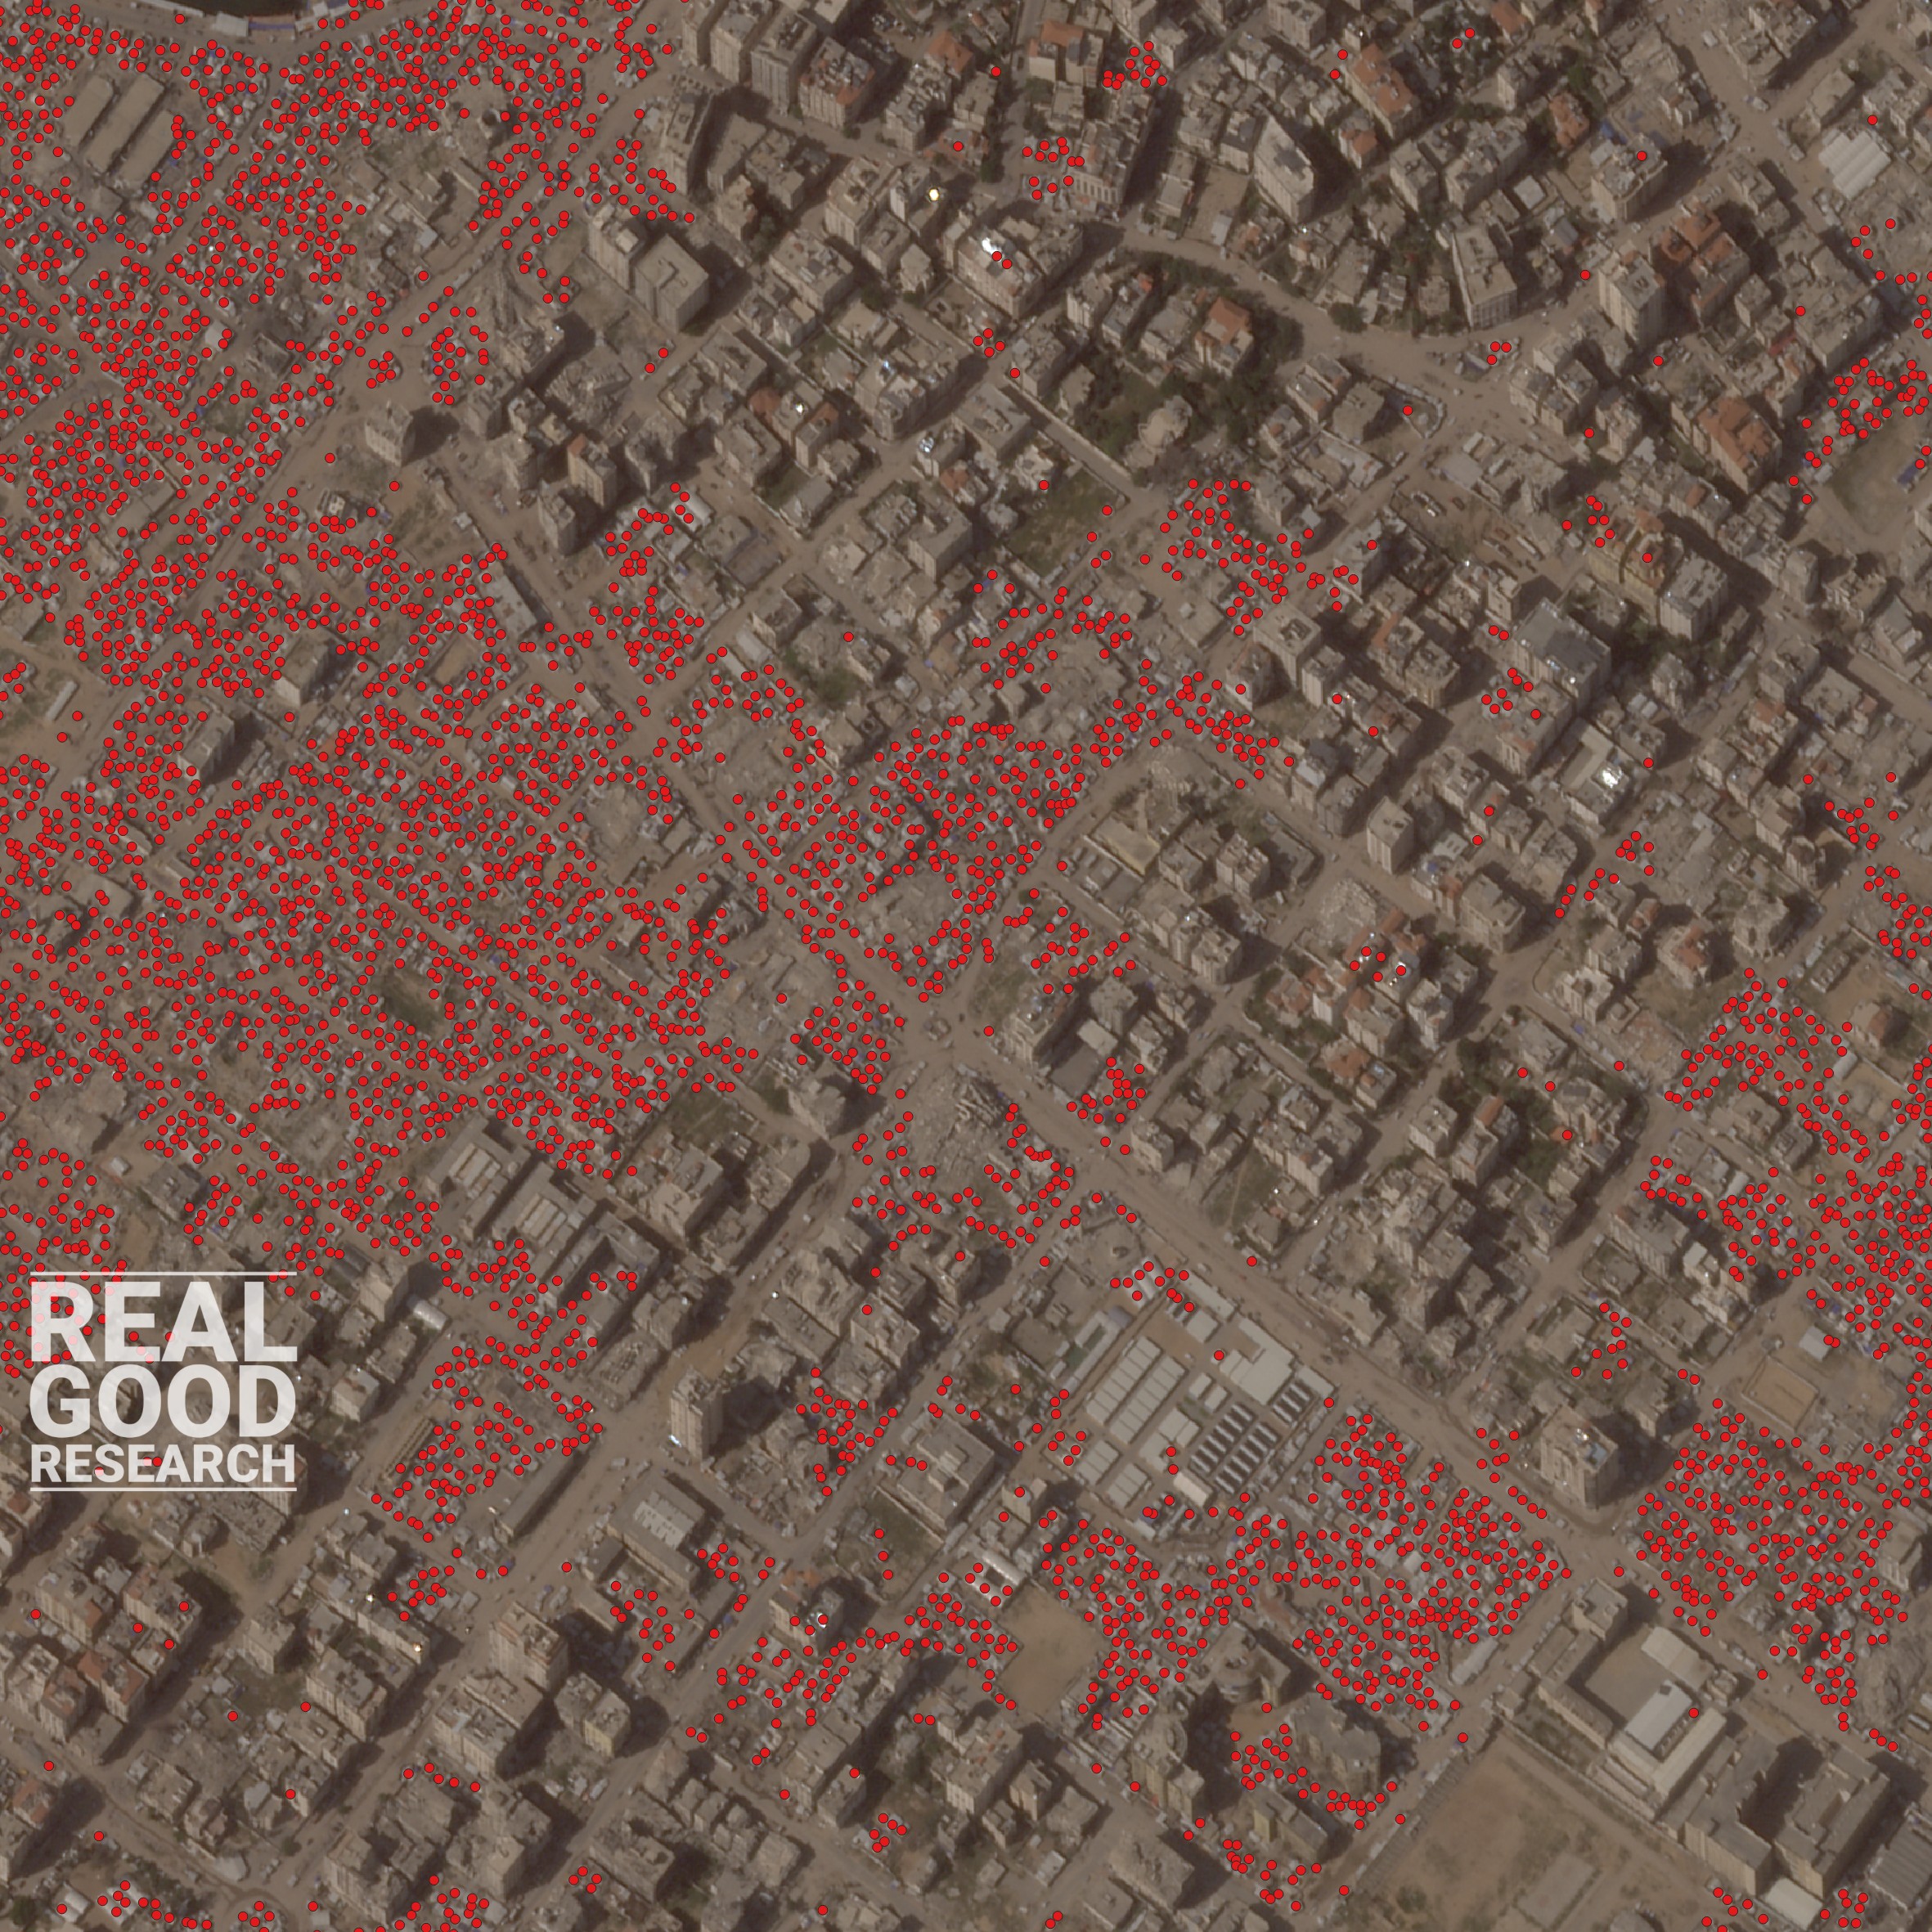
Jess Rapson's account of TentNetFA describes work with Karim and Forensic Architecture on tent-density and location predictions, including manual-count validation. Our experiment used bounding boxes, and their prediction markers also helped generate our candidate labels.
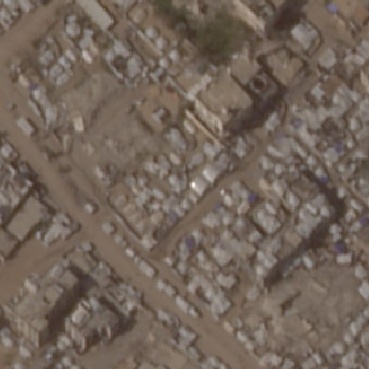
The panels below follow the same patch of imagery from clean pixels to labels and detector output. TentNetFA predictions are shown alongside them because they helped us build the tent labels. They are part of the input to this experiment, so this is not an independent accuracy comparison.
INPUT · Gaza crop
LABELS · Our training annotations
MODEL DETECTIONS · Our detector
REFERENCE MODEL PREDICTIONS · TentNetFA
Trying this with your own imagery
Start with a few clear crops and one class you can define consistently. Generate structured labels, draw them back onto the images and review both the boxes and the omissions. Freeze a first dataset, train a detector and inspect it on a reserved scene.
The companion repository includes label conversion and local inference. The tested final Small checkpoint is available in the v0.1.0 release. It is a starting point for trying the software; it does not reproduce the full training or historical scene workflow.
Our next scientific test would compare original and adapted checkpoints on the same independently annotated scenes, reporting Gaza and Sudan separately. It would also need confirmed target-context tent examples, more varied settlements and roofs, and consistent image preparation.
This attempt showed that assisted labels could support a working small detector. It also showed that a promising overlay and a source-scene score are not enough to establish reliable transfer. If the objects are only a few indistinct pixels, a better prompt cannot recover their shape. Defensible counts and operational use need independent labels and evaluation against the actual task.
If you are exploring object detection on aerial or satellite imagery, tell us about your data and what you need to detect.
Sources
- OpenAI, ChatGPT image inputs. Account limits and model access vary.
- Roboflow, Auto Label with GPT-6 Astra and RF-DETR documentation.
- Jess Rapson, Tracking conflict displacement, and the TentNetFA repository.
- Supervision NMS documentation and the COCO evaluator.
- Axis Spatial pilot report, annotation records, hosted dataset metadata and October inference checks. The figures and scores describe this exploratory pilot.