
Nemotron 3 Nano Omni 30B (Reasoning) vs Nemotron 3.5 Super 120B (Reasoning)
Results updated 9 November 2026 · Both in Terminus-2 · How we benchmark
Verdict

Nemotron 3.5 Super 120B (Reasoning) clearly beats Nemotron 3 Nano Omni 30B (Reasoning) by 35 points, and is cheaper; Nemotron 3 Nano Omni 30B (Reasoning) is faster.
- Cost per task
- $0.13 vs $0.011
- Time per task
- 4.6 min vs 13.8 min
- Tokens per attempt
- 564k vs 105k
- Image input
- Yes vs No
Nemotron 3.5 Super 120B (Reasoning), Terminus-2 scores higher than Nemotron 3 Nano Omni 30B (Reasoning), Terminus-2 on all 3 evaluations scored for both. Nemotron 3.5 Super 120B (Reasoning), Terminus-2 is cheaper ($0.011 against $0.13 per task), but Nemotron 3 Nano Omni 30B (Reasoning), Terminus-2 is faster (4.6 min against 13.8 min).
Where they differ most
By kind of work, share of tasks passed, 0 to 100 · Higher is better
| Kind of work | Nemotron 3 Nano Omni 30B (Reasoning) | Nemotron 3.5 Super 120B (Reasoning) |
|---|---|---|
| GIS analysis | 7 | 70 |
| Making maps | 16 | 70 |
| Remote sensing and raster analysis | 17 | 54 |
| Change detection | 28 | 56 |
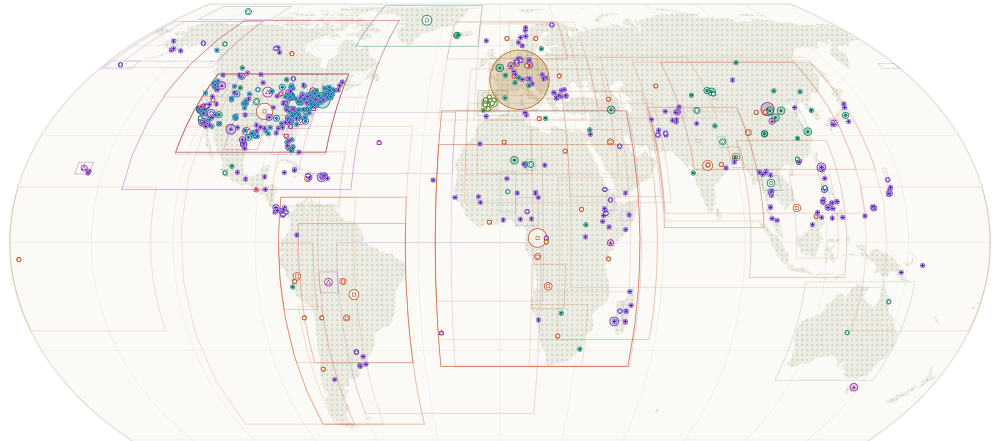 Where the tasks are set: each kind of work links to its tasks and scores
Charts for each: Nemotron 3 Nano Omni 30B (Reasoning), Terminus-2 · Nemotron 3.5 Super 120B (Reasoning), Terminus-2.
Side by side
| Metric | Nemotron 3 Nano Omni 30B (Reasoning), Terminus-2 | Nemotron 3.5 Super 120B (Reasoning), Terminus-2 |
|---|---|---|
| Geospatial Agent Index: Text only | 21 | 56 |
| Geospatial Agent Index: Text + vision | No data | No data |
| Earth-Bench V2 score | 31 | 49 |
| GeoBenchX score | 23 | 56 |
| GS-QA2 score | 9 | 63 |
| Vision agents score | No data | No data |
| GeoAgentBench score (Guided workflows; not in the Agent Index) | 28 | 83 |
| GeoAnalystBench score (Guided workflows; not in the Agent Index) | 16 | 79 |
| OGD4All score (standalone; in no index) | 47 | 85 |
| GeoNatureAgent score (standalone; in no index) | 0 | 100 |
| MultiGlobeQA score (standalone; in no index) | 48 | 70 |
| GeoAgentEval score (standalone; in no index) | 48 | 84 |
| ImpactMesh score (standalone; in no index) | No data | No data |
| Remote sensing and raster analysis score | 17 | 54 |
| Change detection score | 28 | 56 |
| GIS analysis score | 7 | 70 |
| Climate and time series score | 28 | 50 |
| Making maps score | 16 | 70 |
| Cost per task | $0.13 | $0.011 |
| Time per task (at 100 output tokens/s) | 4.6 min | 13.8 min |
| Tokens per attempt | 564k | 105k |
| Turns per attempt | 30.2 | 10.5 |
| Input price per 1M tokens | No data | $0.20 |
| Output price per 1M tokens | No data | $0.50 |
| Context window | 256,000 | 262,144 |
| Image input | Yes | No |
| Developer | NVIDIA | NVIDIA |