
GLM-5.3-Flash (max) vs Claude Sonnet 5.5 (max)
Results updated 3 November 2026 · Both in Claude Code · How we benchmark
Verdict


Not comparable yet: Claude Sonnet 5.5 (max) is not yet ranked.
- Cost per task
- $0.093 vs $0.54
- Time per task
- 6.5 min (estimated) vs 5.6 min (estimated)
- Tokens per attempt
- 962k vs 649k
- Image input
- Yes vs Yes
GLM-5.3-Flash (max), Claude Code scores higher on Earth-Bench V2; Claude Sonnet 5.5 (max), Claude Code scores higher on GeoBenchX, GS-QA2 and Vision agents. GLM-5.3-Flash (max), Claude Code is cheaper ($0.093 against $0.54 per task), but Claude Sonnet 5.5 (max), Claude Code is faster (5.6 min against 6.5 min).
Not yet ranked. Claude Sonnet 5.5 (max), Claude Code. Not in the Agent Index, cost and time charts until it has a score on every index evaluation. Results so far are in the side-by-side table.
Where they differ most
By kind of work, share of tasks passed, 0 to 100 · Higher is better
| Kind of work | GLM-5.3-Flash (max) | Claude Sonnet 5.5 (max) |
|---|---|---|
| Spatial statistics | 78 | 100 |
| GIS analysis | 79 | 95 |
| Remote sensing and raster analysis | 74 | 88 |
| Recognising infeasible requests | 65 | 75 |
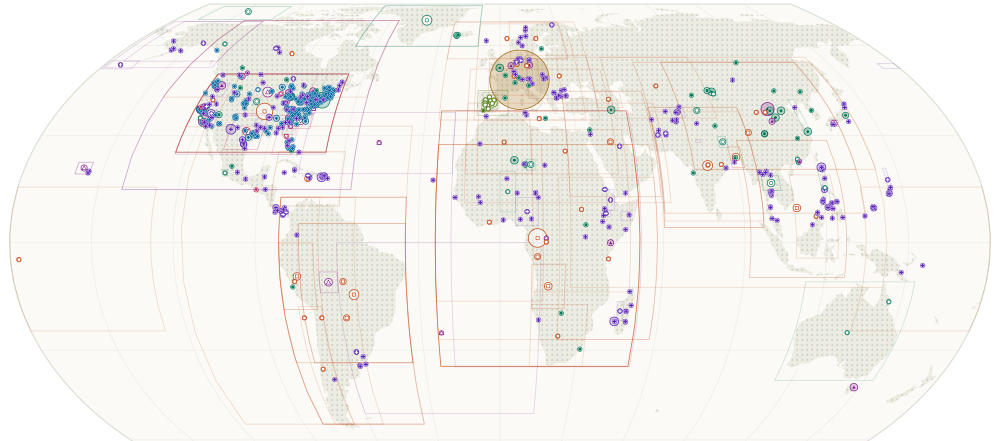 Where the tasks are set: each kind of work links to its tasks and scores
Charts for each: GLM-5.3-Flash (max), Claude Code · Claude Sonnet 5.5 (max), Claude Code.
Side by side
| Metric | GLM-5.3-Flash (max), Claude Code | Claude Sonnet 5.5 (max), Claude Code |
|---|---|---|
| Geospatial Agent Index: Text only | 72 | 75 |
| Geospatial Agent Index: Text + vision | 73 | No data |
| Earth-Bench V2 score | 69 | 57 |
| GeoBenchX score | 70 | 77 |
| GS-QA2 score | 76 | 92 |
| Vision agents score | 78 | 89 |
| GeoAgentBench score (Guided workflows; not in the Agent Index) | 98 | 100 |
| GeoAnalystBench score (Guided workflows; not in the Agent Index) | 100 | 100 |
| OGD4All score (standalone; in no index) | 93 | 97 |
| GeoNatureAgent score (standalone; in no index) | 100 | 100 |
| MultiGlobeQA score (standalone; in no index) | 73 | 78 |
| GeoAgentEval score (standalone; in no index) | 96 | 100 |
| Remote sensing and raster analysis score | 74 | 88 |
| GIS analysis score | 79 | 95 |
| Climate and time series score | 67 | 58 |
| Spatial statistics score | 78 | 100 |
| Making maps score | 74 | 78 |
| Recognising infeasible requests score | 65 | 75 |
| Cost per task | $0.093 | $0.54 |
| Time per task (at 100 output tokens/s) | 6.5 min (estimated) | 5.6 min (estimated) |
| Tokens per attempt | 962k | 649k |
| Turns per attempt | 18.9 | 12.8 |
| Input price per 1M tokens | $0.15 | $2.00 |
| Output price per 1M tokens | $0.50 | $10.00 |
| Context window | 1,048,576 | 1,000,000 |
| Image input | Yes | Yes |
| Developer | Z.ai | Anthropic |